

📊 Dashboard
Once you log in, you’ll be directed to your Dashboard.
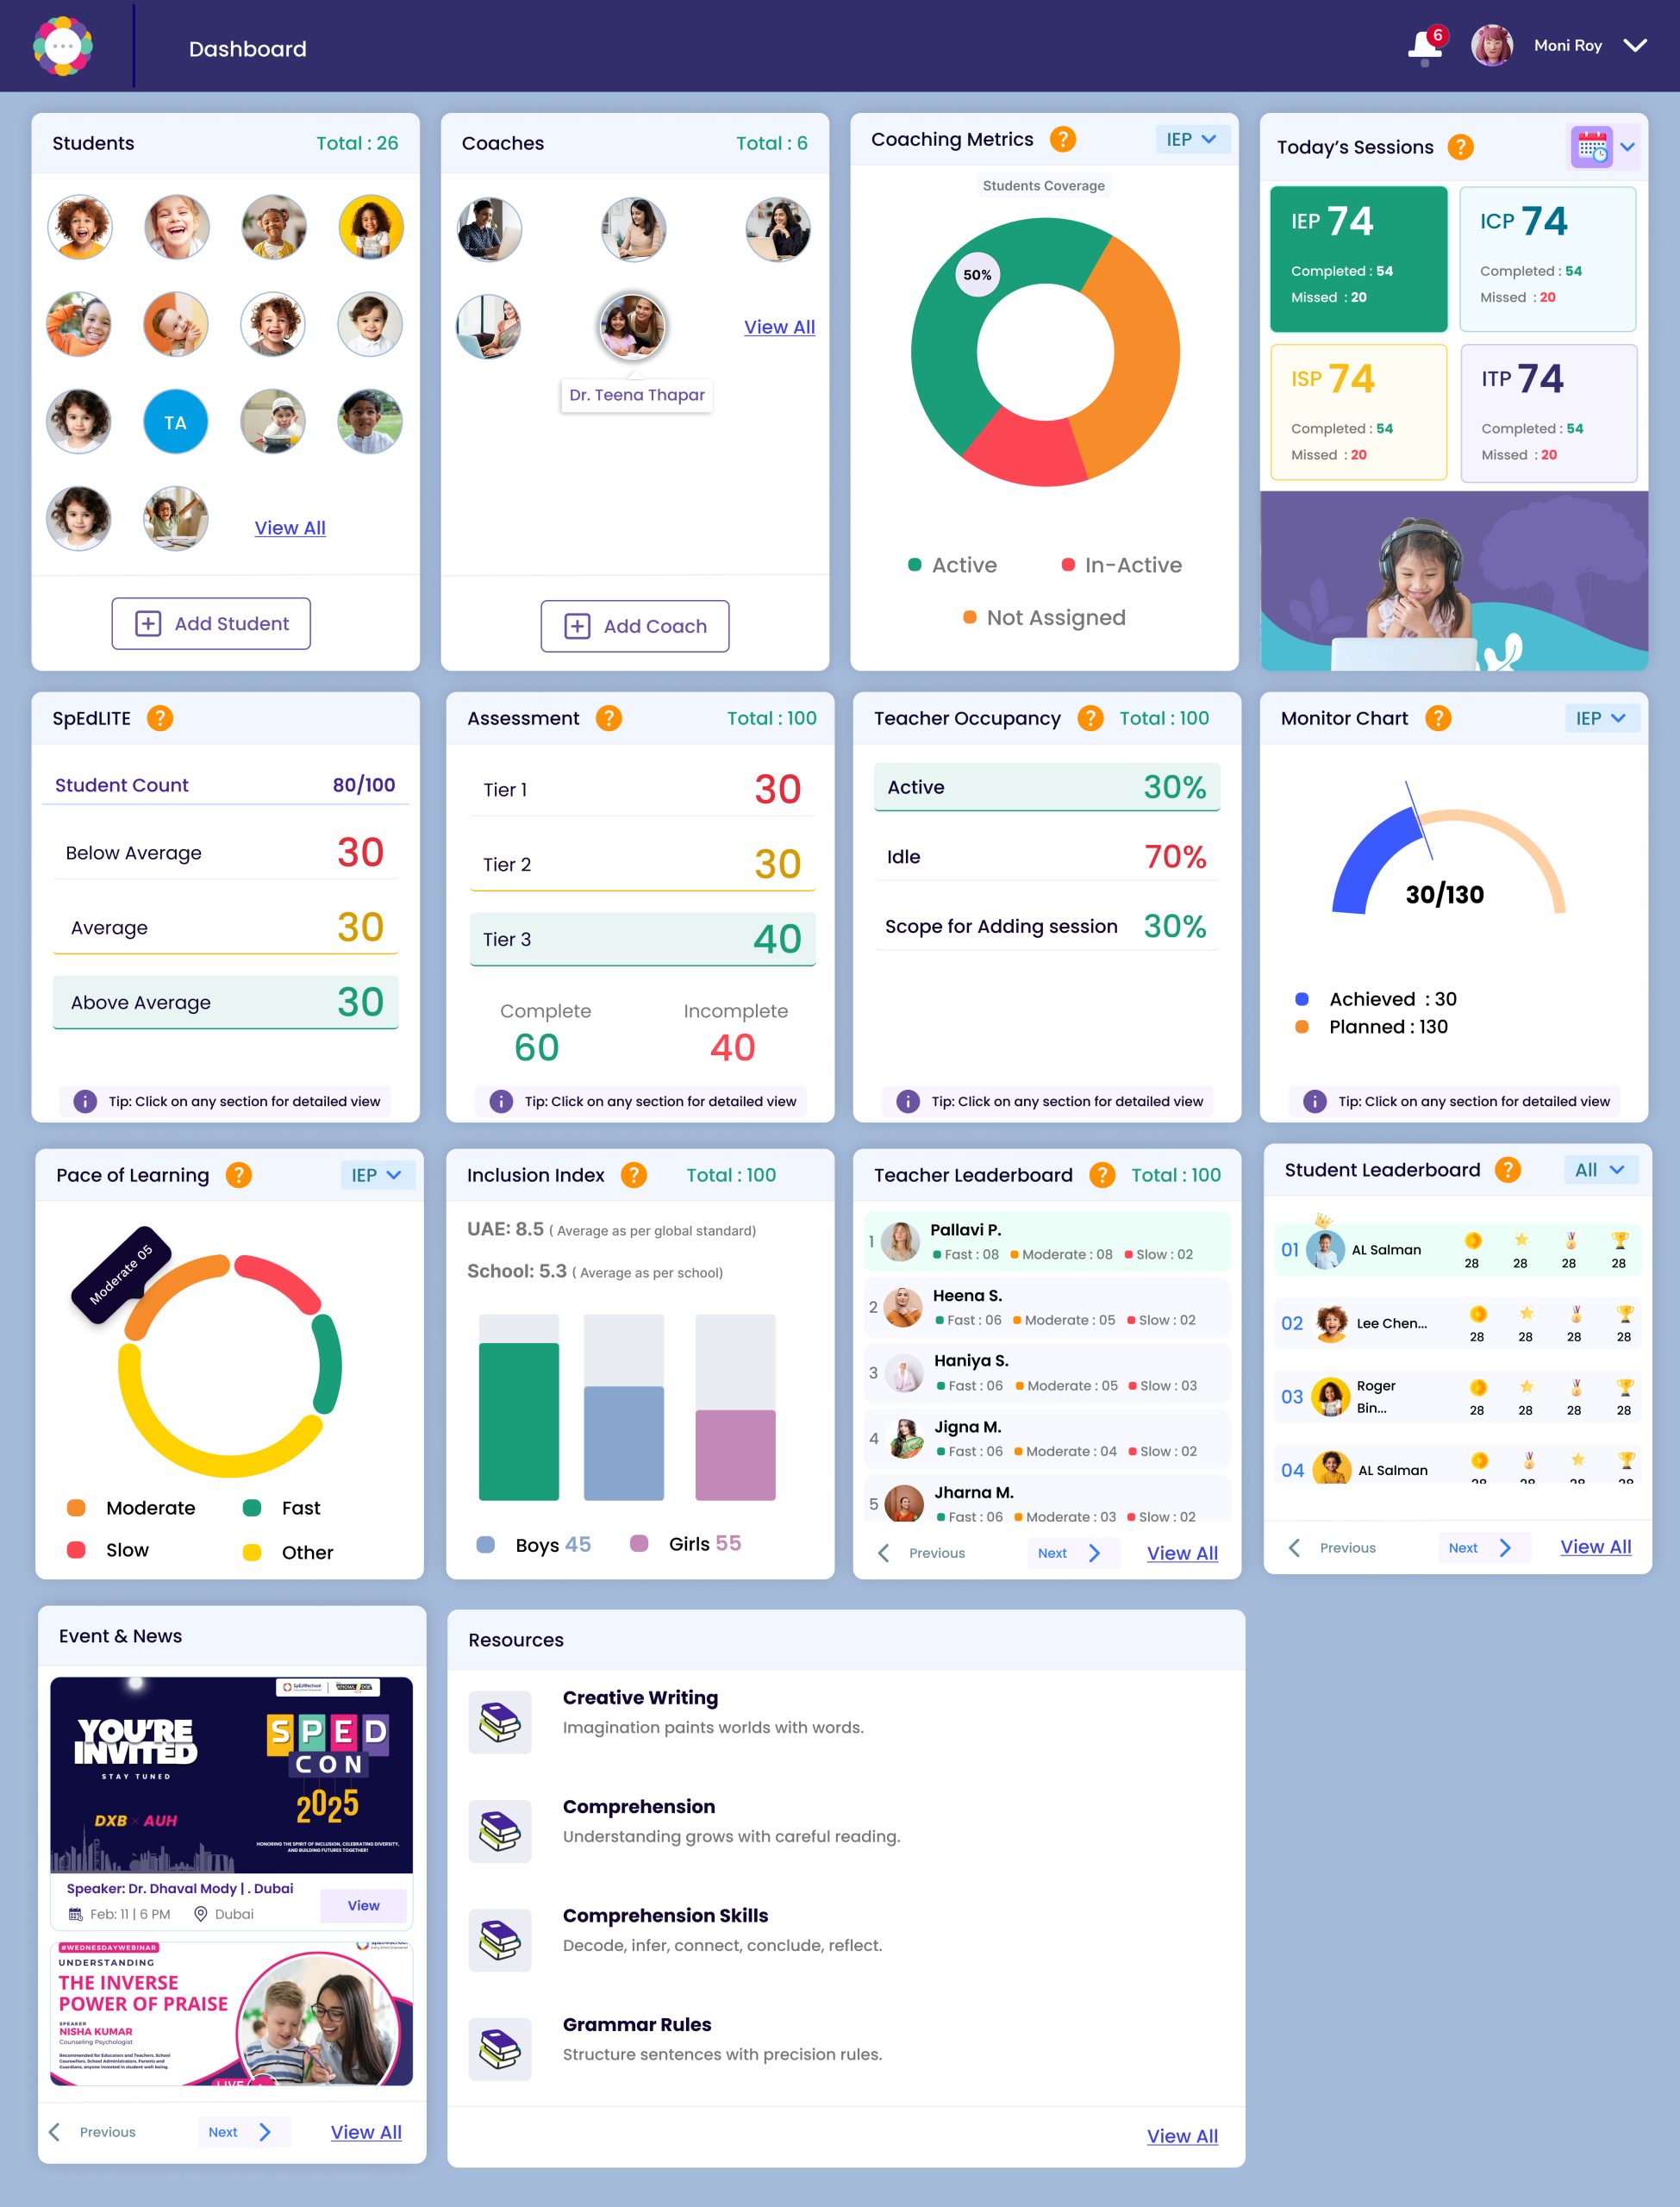
This screen features multiple cards that provide a quick snapshot of your portal usage, including key metrics, recent activity, and important updates—so you can easily track progress and stay informed.
Students
This section displays the total number of students added to both the coach and admin portals. Coaches and admins can easily access student profiles or add new students using the ‘Add Student’ button. The ‘View All’ option provides a detailed list with advanced filters and student progress insights.
Coaches
This option is visible only in the admin portal and displays all the coaches or therapists currently assigned to your school or center. Admins can add new coaches and have the authority to grant access to other coaches, allowing them to add coaches themselves. By clicking on ‘View All’, admins can manage coach profiles and assign user rights.
Coaching Metrics
This donut chart helps you track which students are Active, Inactive, or still Not Assigned to any coach. It gives you a quick idea of overall student coverage to ensure no one is left out.
Today’s Sessions
This area tracks all sessions scheduled for the day across different programs like:
IEP (Individualized Education Plan)
ICP (Individual Cognitive Plan)
ISP (Individual Sensory Plan)
ITP (Individual Therapy Plan)
Each shows:
Completed sessions
Missed sessions
So, you can instantly see daily performance and follow up accordingly.
SpEdLITE (Student Progress Insight)
This shows the overall performance of your students, categorized as:
Below Average
Average
Above Average
It gives a quick academic health indicator of your student base.
Assessment
You can monitor the status of student assessments here:
Tier 1, 2, and 3 refer to different levels of intervention identified for the student from the assessment conducted.
Complete/Incomplete shows how many students have finished their assessments.This helps you identify pending assessments that need immediate attention.
Teacher Occupancy
Shows how well the teachers/coaches are utilized:
Active: Currently conducting sessions
Idle: Available but not scheduled
Scope for Adding Session: Helps you plan and optimize coach capacity efficiently.
Monitor Chart
This section shows how many sessions have been achieved vs. planned for the term. It’s ideal for tracking the monthly or term-wise targets.
Pace of Learning
Pace of learning indicates the speed and accuracy with which a student is able to learn and this donut chart visualizes students’ progress.
Fast, Moderate, or Slow
It helps you identify which students may need additional support or enrichment.
Inclusion Index
Tracks number of boys and girls identified as children with special needs as a percentage of total number of students in the school.
Compares the school’s average with the global average of students identified
Leaderboards
✅ Teacher Leaderboard:
Ranks teachers based on the speed and effectiveness of sessions (Fast, Moderate, Slow). This motivates performance and identifies top contributors.
✅ Student Leaderboard:
Displays top-performing students based on participation and progress, encouraging healthy competition and recognition.
📣 Events & News
This section highlights upcoming webinars, training, or conferences. You can stay updated on relevant professional development and special events.
📚 Resources
Provides quick access to teaching and learning materials like:
Creative Writing
Grammar Rules
Comprehension
These resources can be used by coaches to prepare for a session, as a refresher or students during sessions.